

One of the questions I get a lot these days is, “How can I learn data analysis without actually taking a statistics course?” In this post, I will relay my answers to that question.
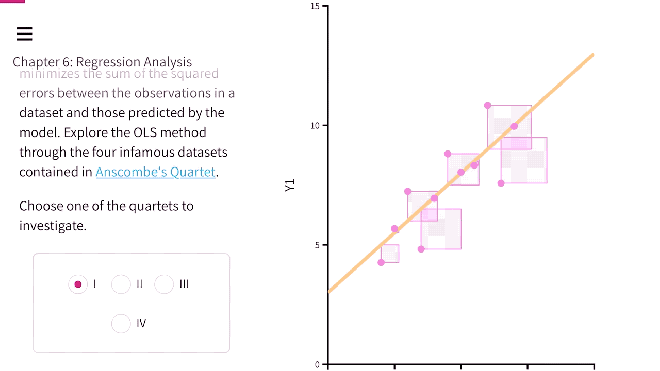
First, if, like me, you sometimes need help understanding or explaining statistical concepts and data analysis, then I highly recommend visiting the Seeing Theory website where you can
- spend hours Ooo-ing and Ahh-ing over beautiful visualizations of the math behind a statistical analysis.
- interactively manipulate data and see its visualized impact on statistical analyses in real time—so cool!
- download a draft of the Seeing Theory textbook for free.
The Seeing Theory website will surely be useful to you no matter which of the following approaches you take to learning stats.
1. R (and Rstudio): Powerful; Learning-curve
“If you know R, you’ll never be unemployed.” That’s a line I hear a lot, lately. Why? Because data analysis skills are in demand. And R is used in both industry and academia. So, if you know R, you are more likely to find employment.
R is a program and a language. It’s free (on both Mac and Windows) and it’s really powerful. A downside is that it is a command line interface with its own language, so it involves learning new (but relatively easy) syntax (just like learning symbolic logic or HTML). You can download R (which runs in the background) here and RStudio (the app you use to analyze data using R) here. The book Getting Started With RStudio is a decent primer. If you like videos, then this introductory workshop video by Ashley Edwards might suit you well.
Or if you want to just get started with minimal textbooks or instruction, check out the 8-page “Getting Started in R” Guide (complete with its own datasets).
Once you’ve gleaned the basics of R, you might benefit from following advanced R users like Danielle Navarro (below) and others. Oh, and you will probably benefit from Navarro’s free Learning Statistics with R.
2. Jamovi: Point-and-click, based on R
Jamovi is built on top of the R statistical language allowing for Jamovi workflows to be reproduced in R. Fortunately, unlike R, Jamovi is a point-and-click visual interface (as opposed to a command-line interface like R) with the ability to see one’s data in spreadsheet form, which may be more familiar with many people.
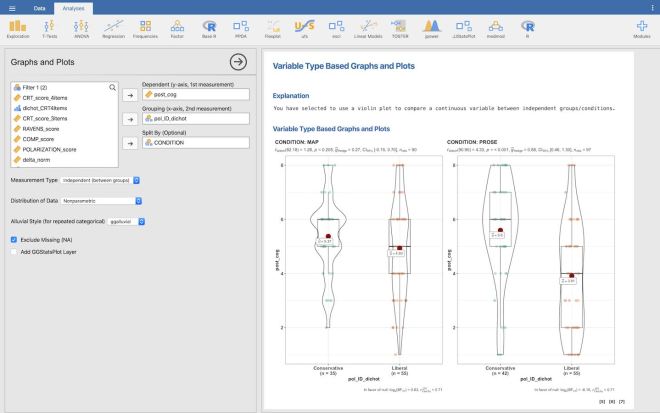
Jamovi also has free modules (like R’s packages) that can be installed to unlock new capabilities. For instance, modules like JJStatsPlot can be installed to produce fantastic data visualizations with the click of just a few buttons.
More good news. There are free Jamovi stats textbooks based on the free R stats textbooks! Try Learn Stats With Jamovi by Navarro and Foxcroft. And did I mention that you should follow @djnavarro yet?
3. JASP: Point-and-click; In development
JASP might be the newest and easiest program to use: it’s point-and-click rather than code-and-run. It allows you to do most of the basics (and it is gaining new abilities frequently). Here’s a tutorial for JASP (in addition to the one above from Dr. Navarro, who you should follow). You can download JASP here.

I don’t have a good sense of how many people in industry are using JASP for data analysis. So, I am not sure how well JASP skills will transfer outside of academia.
4. Spreadsheets: Learn the math!
The first grad stats course I took required students to do the analyses with pencil and paper (and a basic calculator, where applicable). It forced me to learn much of the math involved in basic data analysis, which is helpful even today. Once you know the math, you are more likely to notice errors in your analysis that programs like R and JASP (and the rest) do not tell you about.
Another way to learn the math is to use a spreadsheet app like Excel. Just enter your data and then build functions to calculate means, standard deviations, predictions, and residuals. And you can plug those values into more functions to get more values. It’s usually not something I recommend to everyone, but if you are outstandingly interested in actually understanding the math and you can enjoy tinkering, then you might actually prefer this option. Pretty much every stats book will give you the equations you need—e.g., this book by Judd, McClelland, and Ryan (2017) and this book by Maxwell, Delaney, and Kelley (2018).

Obviously, spreadsheets are used everywhere. So if you can master the basic mathematical functions of a program like Excel, then you’ll have a skill set that easily transfers outside of academia.
Off you go!
In my experience. The easiest way to learn this stuff is to sit through a course on it. That way someone can save you hours of confusion or running down rabbit holes when you have a question. While Google searches are very helpful, I find that they are rarely better than humans who are in the same room and already know how to do what you are trying to learn.
But I imagine that, in principle, these tools can be learned well enough on one’s own.
Disclaimer. I realize that I didn’t mention common tools like SAS and SPSS. Why? Do I think that they are bad or dumb or beneath me?! No. I have used them while co-authoring papers and while learning data analysis. However, I have never found them so indispensable that I am willing to pay for them or to limit myself to Windows-based apps. If that changes, then I imagine that I will probably update this post.